Example_2_3#
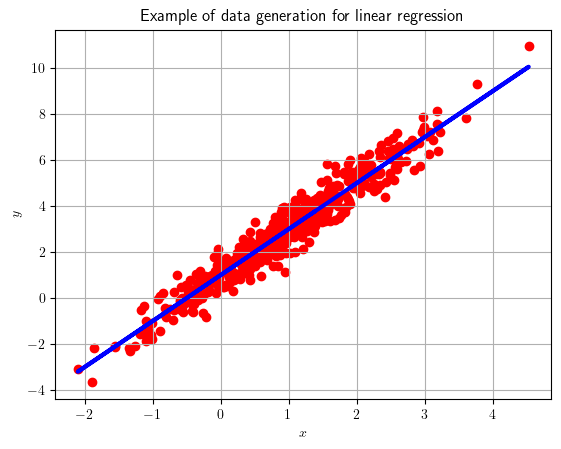
Generate data for regression exercises.
!wget --no-cache -O init.py -q https://raw.githubusercontent.com/jdariasl/OTBD/main/content/init.py
import init; init.init(force_download=False)
#!sudo apt install cm-super dvipng texlive-latex-extra texlive-latex-recommended
import numpy as np
import matplotlib.pyplot as plt
from local.lib.Generation import Get_data_reg
d = 1                                      # Dimensionality of data vector
mean_x= np.array([1])                      # Mean of input data
coef_corr_x=0.2;                           # Correlation coefficient of input data
var_x=1                                    # Variance of input data
reg_opt=np.array([2,1])                    # Optimum regressor
var_pert=0.3                               # Variance of the perturbation

# Build data struct
# ===========================
data_reg = {'d': d,
            'Mean_x': mean_x,
            'Coef_corr_x': coef_corr_x,
            'Var_x': var_x,
            'Reg_opt': reg_opt,
            'Var_pert':var_pert}

# Data variables
# ===========================
X,y=Get_data_reg(data_reg,500);
plt.rcParams['text.usetex'] = True
plt.scatter(X,y,color='r',marker='o')
plt.plot(X,X*data_reg['Reg_opt'][0:data_reg['d']]+data_reg['Reg_opt'][data_reg['d']],color='b',linewidth = 3)
plt.title('Example of data generation for linear regression')
plt.xlabel(r'$x$')
plt.ylabel(r'$y$')
plt.grid()


