Example_2_7#
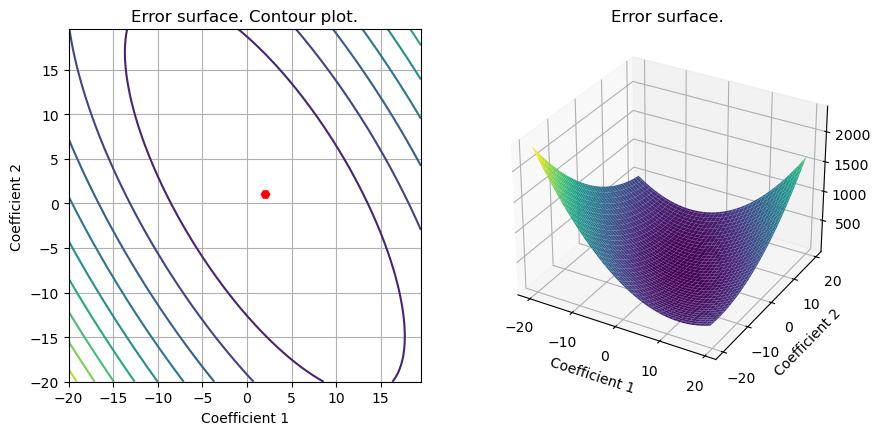
Ploting loss function contour and surface.
!wget --no-cache -O init.py -q https://raw.githubusercontent.com/jdariasl/OTBD/main/content/init.py
import init; init.init(force_download=False)
from local.lib.Generation import scenarios_regression
from local.lib.utils import plot_surface
#!pip install cvxpy
import cvxpy as cp
# Loading scenarios
# ===========================
scenario=1;
data_reg, set_up=scenarios_regression(scenario);

# Definition of the problem
#===================================
loss_LS = lambda n, X, Y, w, lambd: (1/n)*cp.pnorm(X @ w - Y, p=2)**2

# We draw the surface (just when M=1)
S1=plot_surface(set_up,loss_LS,data_reg['Reg_opt']);


