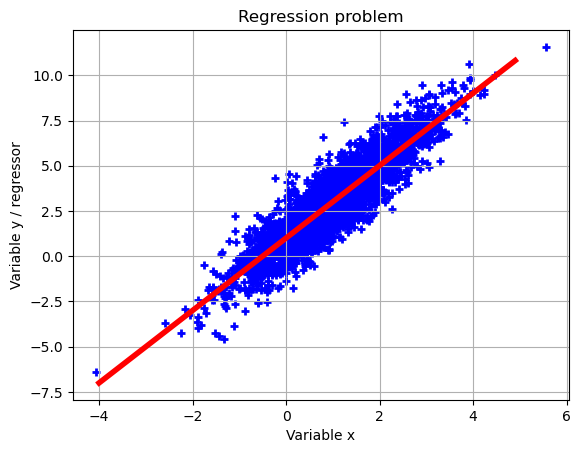
Example_2_8#
Plot the linear regression and estimate the error
!wget --no-cache -O init.py -q https://raw.githubusercontent.com/jdariasl/OTBD/main/content/init.py
import init; init.init(force_download=False)
from local.lib.Generation import scenarios_regression
from local.lib.utils import plot_surface, solver_cvx, test_phase_reg
import matplotlib.pyplot as plt
#!pip install cvxpy
import cvxpy as cp
# Loading scenarios
# ===========================
scenario=1;
data_reg, set_up=scenarios_regression(scenario);

# Definition of the problem
#===================================
loss_LS = lambda n, X, Y, w, lambd: (1/n)*cp.pnorm(X @ w - Y, p=2)**2

# Solution of the empirical risk using CVX
#=========================================
x_cvx=solver_cvx(set_up,loss_LS);

# We test the regression solution
plt.scatter(set_up['Xtrain'][:,0],set_up['ytrain'][:,0],marker='+',color ='b',linewidth = 2)
plt.grid()
plt.xlabel('Variable x')
plt.ylabel('Variable y / regressor')
plt.title('Regression problem')
error=test_phase_reg(set_up,x_cvx,'r')
0.018386209116195967


